Software and Data Acquisition
DAQ Hardware
The data acquisition (hereinafter DAQ) platform used with this system is a National Instruments PCI-6070E (formerly PCI-MIO-16E-1) acquisition board, connected to a BNC-2090 BNC terminal block via a SH68-68 shielded data cable. The two DAC output channels of the board supply the drive signals (scanner waveforms) for the piezo disk actuator. Three analog input channels are used to record the AFM's output signal and the scanner waveforms, which are then used to assemble an image.
For ease of observation, a simple two-channel analog oscilloscope (we use the OS-5020 from EZ Digital) is also connected, and any necessary voltage gain is provided by an additional amplifier (Tektronix TM502). Refer to Section 3.2.2 and Figure 7 on p. 7 of this lab manual for the details of signal flow and cable connections between the DAQ board, AFM and the other electronics.
Software
MATLAB
|
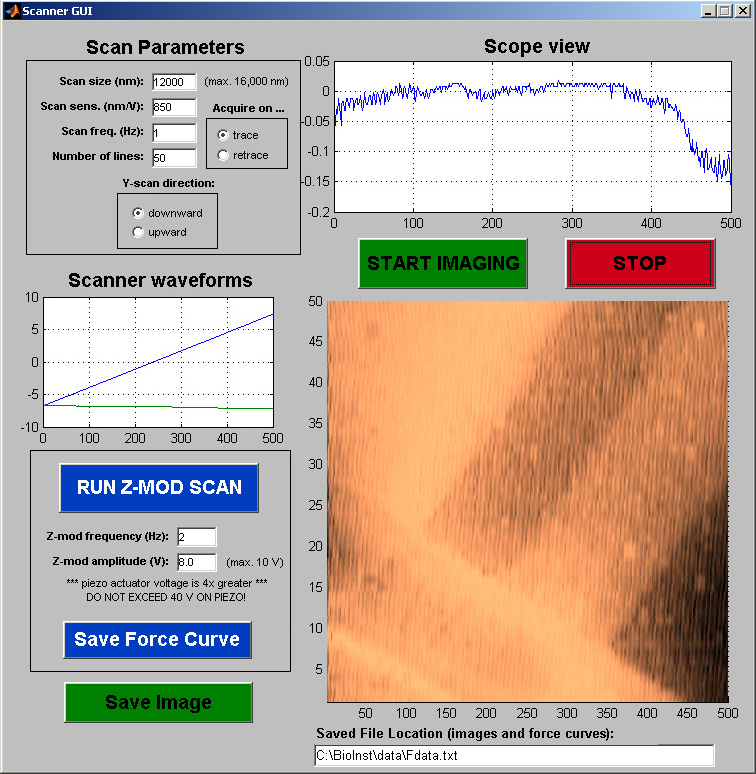
The educational AFM system is controlled using custom-written MATLAB software that interfaces with the DAQ hardware, outputs and reads all AFM signals, and includes a graphical user interface (GUI) that displays the image and scanner waveforms in realtime. For a user's perspective on how to use the features of the software to operate the AFM, refer to Section 3.3 and Figure 10 (p. 10ff) in the lab manual.
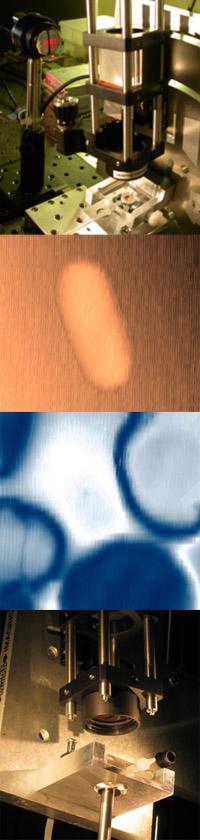
Operating ModesNote: Due to our emphasis on simplicity and accessibility for the purposes of teaching, these AFMs have no feedback electronics, and (for that reason and others) are not capable of more advanced imaging modes available on commercial instruments, such as constant-force mode, "tapping mode", lateral-force mode, etc. However, the instrument was designed to allow operation in fluid, and such experiments are currently in development. Imaging Mode: Here, the sample is scanned in the x-y plane,and the tip is maintained in contact with the surface (constant height mode). Deflections of the tip as it passes over topographical features are recorded, and assembled into an image. Z-modulation: (force spectroscopy): In this mode, the sample is actuated strictly up and down, alternately coming into contacting and releasing the probe tip. This mode is used for calibrating the instrument (relating output signals to physical quantities such as displacement and force), and measuring force vs. distnace curves (e.g. for measuring sample elastic modulus).
Scanner WaveformsThe AFM receives drive signals for the X and Y channels from computer via the DAQ output. Its hardware must be switched manually between the two operational modes, using the DPDT switch (see Motion Control page). In effect, the switch selects between applying voltages of opposite sign to opposite piezo quadrants (for x-y plane actuation - the flexure mode shown at the bottom right in Figure 3), and applying the same voltage to all piezo quadrants (Z-axis actuation). |
Figure 8: A view of the MATLAB graphical user interface (GUI) window used to drive the AFM (click the image for a full size view). |
Imaging Mode: The AFM tip is scanned line-by-line along one axis (fast scan, X), while moving more gradually along the other axis (slow scan, Y), assembling the lines into a 2-D image. Opposite piezo quadrants need to receive voltages opposite in sign for imaging, and therefore the SPDT switch in Figure 4 is set to the upper position, and both the VINVOUT and VOUT branches of the circuit are active.
Z-modulation Mode: For z-axis motion, all piezo disk quadrants must receive the same voltage, and therefore the same signal is output by the software on both the X and Y channels, and the +/-X and +/-Y signals are tied together. The SPDT switch in Figure 4 is set to the lower position, to make VINVOUT = VOUT.
GUI Files
Here you can download the two files required to run this software, which may be used on any installation of MATLAB after Release 13, which includes the data acquisition toolbox.
- scannergui.fig: A layout file specifying the locations of buttons, plots, etc. in the GUI. Edited using the MATLAB utility "GUIDE".
- scannergui.m: The underlying code and subroutines that are called by the various controls within the GUI. Note that some of this is specific to the DAQ hardware used in our system, and will need to be modified for other installations.
LabVIEW
An additional useful piece of software: the Spectrum Analyzer virtual instrument for LabVIEW (and required associated files), used for the thermomechanical noise experiment to measure Boltzmann's Constant (see Section 6 on p. 17 of the lab manual, as well as Sections III and V of the AJP paper).