CityScope AR: Volpe
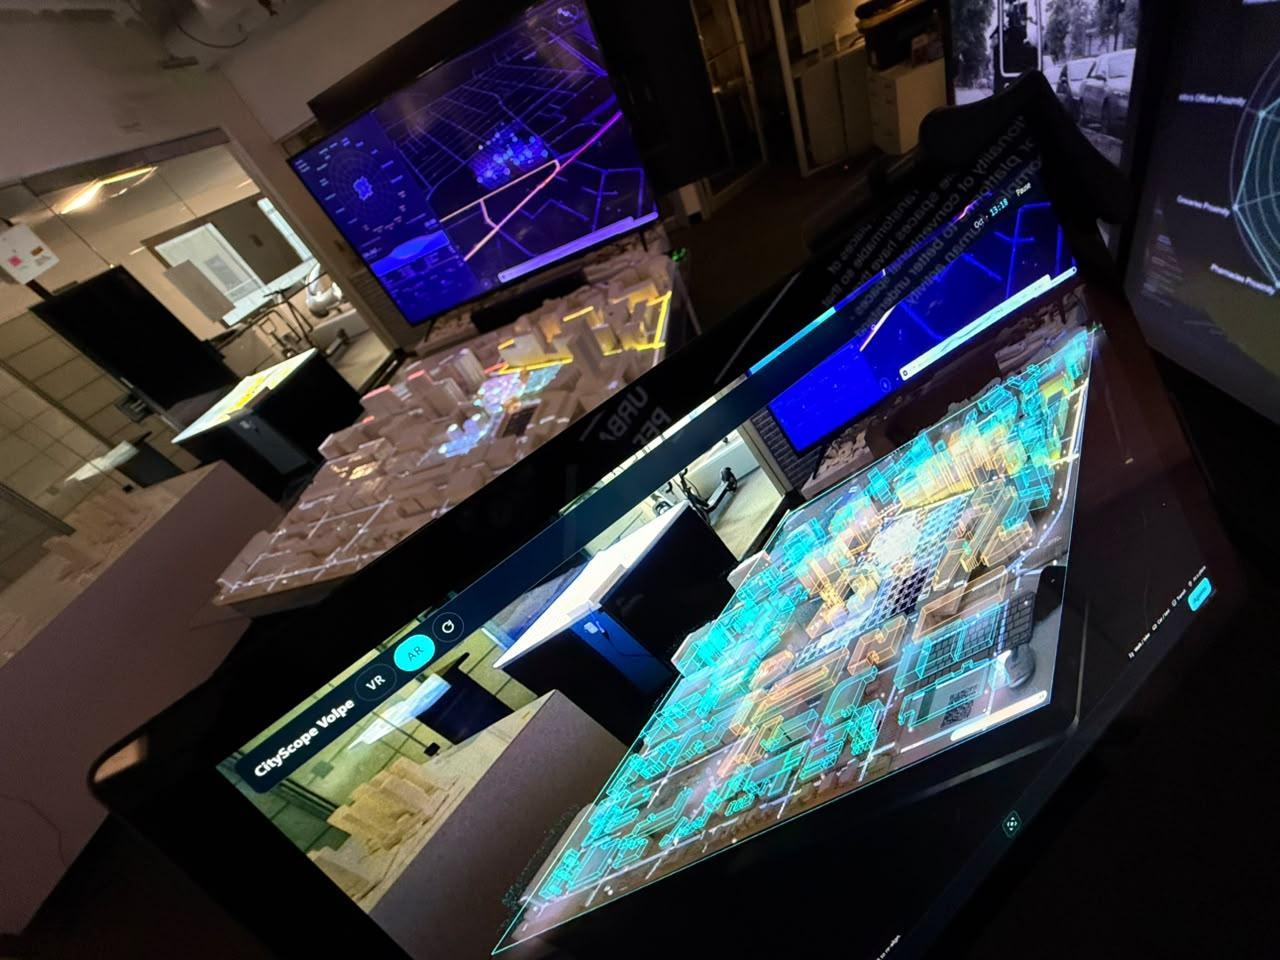
CityScope AR brings a new perspective to the physical CityScope Volpe table. Through a phone or tablet, people can explore a simulated day in Kendall Square, follow people’s journeys, and see proposed buildings take shape on the model—all through a web browser, with nothing to install.
The experience connects the scale of a neighborhood with the lives unfolding within it. A simulated population moves through the streets, revealing how people travel and how different places fill and empty throughout the day. Tap a person to discover their profile and daily journey, or explore how development plans for the Volpe site translate into buildings on the table.
CityScope AR on the physical CityScope Volpe table: the simulated population, occupancy and flows aligned to the model, seen in augmented reality. October 2026.
Mónica Gómez
Why it matters:
Planning decisions shape everyday life: where people go, how they get there, and how they share the city. CityScope tables help people explore these decisions together by projecting information onto a physical model. Augmented reality extends that shared experience into three dimensions, bringing people, journeys, and building heights into view.
Each person can move around the table, follow what interests them, and explore at their own pace, while staying connected to the same physical model and the conversation around it.
How it works:
Connect the digital city to the physical table.
On Android phones with WebXR support, users tap the table’s two front corners to align the digital content with its known dimensions, without printed markers. On devices without WebXR, including iPhones and Windows tablets, a camera-based mode lets users align the content with the table in the camera view.
Follow a day in the district.
The population comes from H-ABM, a synthetic agent-based model representing 224,562 people. Around 72,000 pass through the area covered by the table during the simulated day. Their movements reveal patterns of occupancy and travel across the district. Tapping a person opens a card with their simulated profile and recorded daily journey.
Explore the site’s possible futures.
Development data comes from the Volpe population visualization. A live connection to the installation’s state hub allows the augmented buildings to update as the plan selected on the physical table changes.
See the neighborhood in a different light.
An optional realistic view combines 2023 MassGIS aerial imagery with the site’s buildings and sunlight corresponding to the simulated hour. Facade materials use generic patterns inspired by the district’s buildings.
Where we are now:
CityScope AR is a research prototype in active development. Alignment and visual layers have been tested on an ARCore-enabled Android phone using a stand-in object. The next step is to test the experience on the physical CityScope Volpe table.
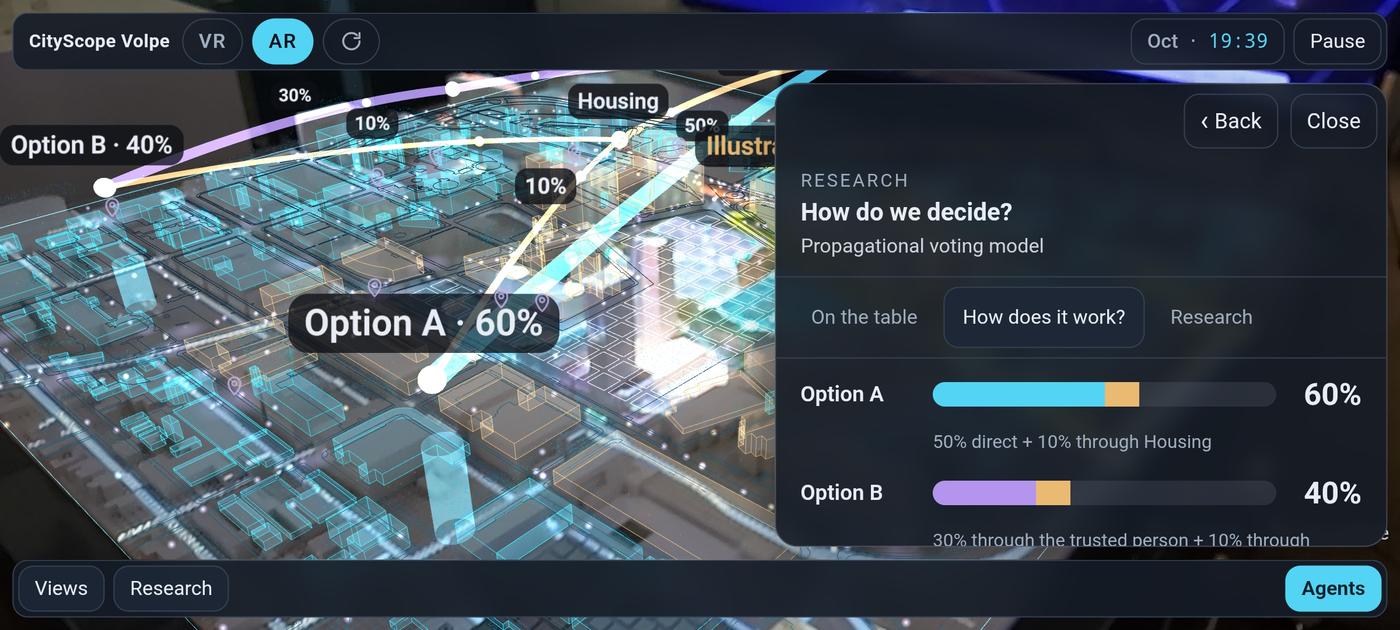
Some elements currently illustrate possibilities for the experience, including towers on segments without an assigned development plan and a voting demonstration. These are identified as illustrative within the app.
Early test of CityScope AR on an Android phone: placement and data layers over a stand-in for the CityScope Volpe table. Research prototype, October 2026.